Working with requests
The Network tab shows network activity of the application at runtime.
Top toolbar
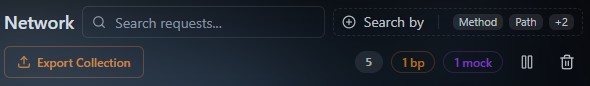
Search
The search box supports multiple modes. The active criteria are chosen in Search by next to the input. The same options exist under Options for that tab so you can preset search types.
| Mode | Description |
|---|---|
| Status code | Search by response status code |
| Method | Search by HTTP method |
| Path | Search by URL or part of the path |
| Name | Search by request name |
| Key | Search by keys in JSON request/response bodies |
| Value | Search by values in JSON request/response bodies |
There is a minimum query length (default 2 characters; configurable in inspector search settings).
Partial vs exact match. If the query is not wrapped in quotes, substring matching is used across enabled modes (case-insensitive for text) — similar to LIKE '%text%'. Exact whole-string matching applies only when the entire query is wrapped in double quotes "...".
For key/value modes the body must parse as JSON; otherwise the search index may be empty.
Status indicators
The right side of the Network toolbar shows status chips. Some are clickable and jump to the related Options section or to a specific log entry.
| Item | Purpose |
|---|---|
| N or N/M | Row count after filters; with active search, M is the total requests in the buffer. |
| pending | Requests still in flight. |
| bp (highlighted, pulse) | Breakpoints waiting for UI action. Click selects the first such row. |
| bp (solid amber) | Count of active breakpoint rules. Click opens Options with all breakpoints. |
| mock | Active mock response rules. Click opens Options → Network → Mock Responses. |
| Paused | Traffic logging to the list is paused. |
When breakpoint rules or mock response rules are suspended globally (see below), the bp and mock chips keep their counts but use a muted style to show that those rules are not applied until you turn them back on.
Log controls
Breakpoint rules and mock responses (global)
Next to Pause recording and Clear, the toolbar has two icon controls that apply to all configured rules of each type (without deleting them):
| Control | Icon (when active) | Meaning |
|---|---|---|
| Breakpoint rules | Pause / stop circle (amber when rules are on) | On: active breakpoint rules can pause matching requests. Click: suspend breakpoints — rules stay in Options → Network → Breakpoints, but no request is held until you enable again. Tooltip: Breakpoints on (click to suspend) / Breakpoints suspended (click to enable). |
| Mock responses | Shuffle (purple when mocks are on) | On: active mock rules can short-circuit matching requests. Click: suspend mocks — rules stay in Options → Network → Mock Responses, but the real network runs until you enable again. Tooltip: Mock responses on (click to suspend) / Mock responses suspended (click to enable). |
The same switches exist as Enable breakpoint rules and Enable mock responses next to the corresponding lists in Options → Network; changing either place updates the other.
Note: Suspending rules is not the same as Pause recording. Pause removes the interceptor from the page and stops logging; the global switches only disable breakpoint or mock handling while the interceptor remains (unless you also pause recording). Details: Traffic interception.
Pause
Pause temporarily stops recording into the Network list.
While paused:
- new requests do not appear in Vue Inspector Network until you resume;
- the interceptor is removed: the page uses native
fetchandXMLHttpRequestagain (no inspector substitution).
Implications:
- in the built-in Network tab of DevTools the same requests show the original initiator (your app code), not the injected script (
injected.js, etc.); - while paused, interception features do not apply: Mock response and Breakpoint (see traffic interception). After Resume, interception and rules are active again.
Clear
Clears accumulated rows next to Pause.
Export Collection
Export Collection saves the current filtered request list (see Export collections).
Work area
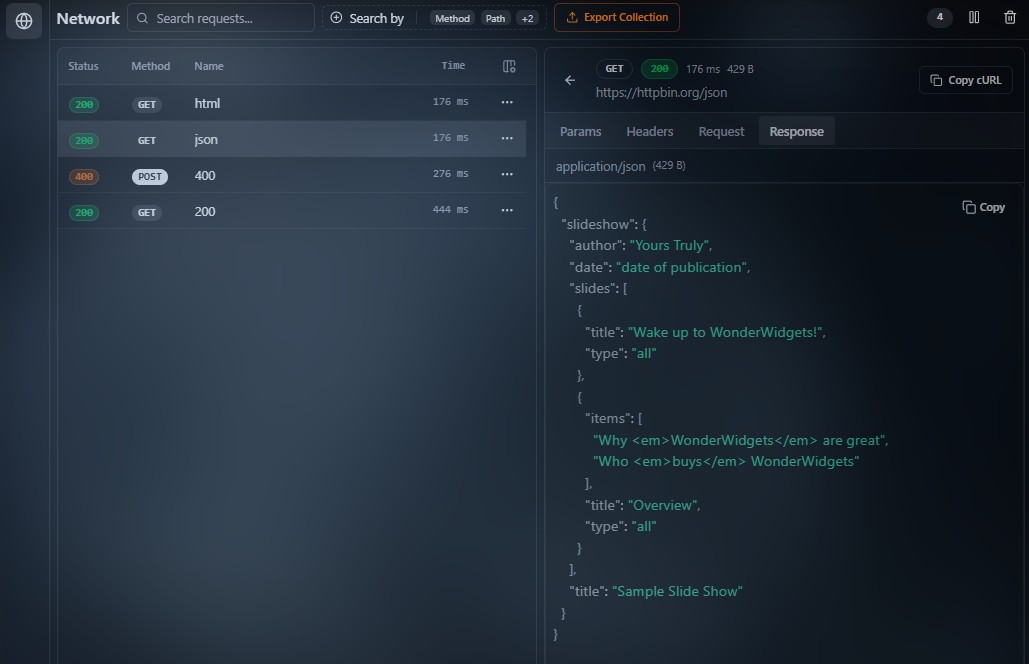
Request list
The left side lists captured requests.
Per request you typically see:
- Name / Path — short name or path;
- Status — HTTP status;
- Time — duration;
- Size — payload size;
Column visibility is configurable.
Request details
Opening a row shows exchange details:
- Headers — request and response headers;
- Params — query string pairs;
- Request — request body;
- Response — response body;
For multipart/form-data bodies captured as structured data, Request is shown as a read-only table: field key, Text or File, cell value (text fields as-is; file fields show name and size, or (binary) when the original bytes are not kept as displayable text). Copy copies the visible text or the file name, depending on the row.
The X-Request-Id header (and similar) may be visually emphasized when present.
Display limits
Reading limits
Vue Inspector only shows headers and bodies visible to page JavaScript after the request completes.
For cross-origin responses browsers apply CORS: not every response header is exposed unless listed in Access-Control-Expose-Headers.
For example, if X-Request-Id is missing from:
Access-Control-Expose-Headers: X-Request-Id(or a list that includes it), the page may not see it in response.headers — and Network will not show it, even if the browser’s native Network tab does.
On same-origin requests headers are usually available unless another policy hides them.
In the Vue Inspector extension for Chrome / Edge, Advanced mode (capture setting under Options → Network) can enrich request and response headers with browser-level data beyond what the page is allowed to read. For details, header pinning, Header links, and related options, see Advanced capture mode.
Very large bodies may be truncated (roughly 20 MB captured text in code); some binary payloads are not serialized as text for the tab.
Storage cap
At most 500 requests are kept.
When the cap is reached, oldest entries are dropped so recent activity remains visible.
How it works
When interception starts
The network module loads with the rest of Vue Inspector in the tab context when you open the inspector overlay or attach the DevTools panel. Until that script runs, fetch / XMLHttpRequest are not patched.
The buffer lives in the page after load; Network reads it whenever the panel is open. Without reload, history remains available when you open Network later (subject to the 500 entry cap).
What is monitored
Calls through:
fetchXMLHttpRequest(XHR)
Not captured, among others:
- other APIs (
navigator.sendBeacon,EventSource, WebSocket,<img>/<script>loads without XHR); - OPTIONS preflights (filtered out);
- extension URLs (
chrome-extension://,moz-extension://, …).
Each row records the initiator type: fetch or xhr.
Interception model
Unlike the browser Network DevTools tab (engine-level), Vue Inspector runs in the page: it wraps global fetch and XHR methods, performs the real network call, then reads whatever the response object exposes to the page (headers, body, status, timing).
Simplified fetch idea:
// Illustration: after the real request, headers come from response.headers.
// Names are limited by the browser (including CORS), not “all” wire headers.
window.fetch = async function patchedFetch(input, init) {
  const response = await originalFetch.call(window, input, init)
  const headersForUi = []
  response.headers.forEach((value, name) => {
    headersForUi.push({ name, value })
  })
  // …send metadata and body to the inspector UI…
  return response
}